
Abstract
The noon report began as a short daily message from ship to office: where the ship is, how fast it is going, how much fuel it has burnt. It is now the primary data source for regulatory emissions reporting, carbon intensity ratings, emissions allowances, charter party performance claims and hull and engine monitoring. The format has not always kept up with that responsibility.
This paper sets out what a noon report needs to contain to carry that weight. It groups the parameters by the officer who owns them, explains how fuel is measured, reconciled and converted to emissions, shows how the same figures roll up into CII and FuelEU Maritime, and describes five checks every report should pass before it is signed. It closes with the practices that turn a daily form into a chain of evidence: one owner per figure, remarks on every exception, signing that locks the record, and corrections that add a revision rather than overwrite the original.
1. One report, many uses
A single noon report is read by more people, for more purposes, than any other routine document a ship produces.
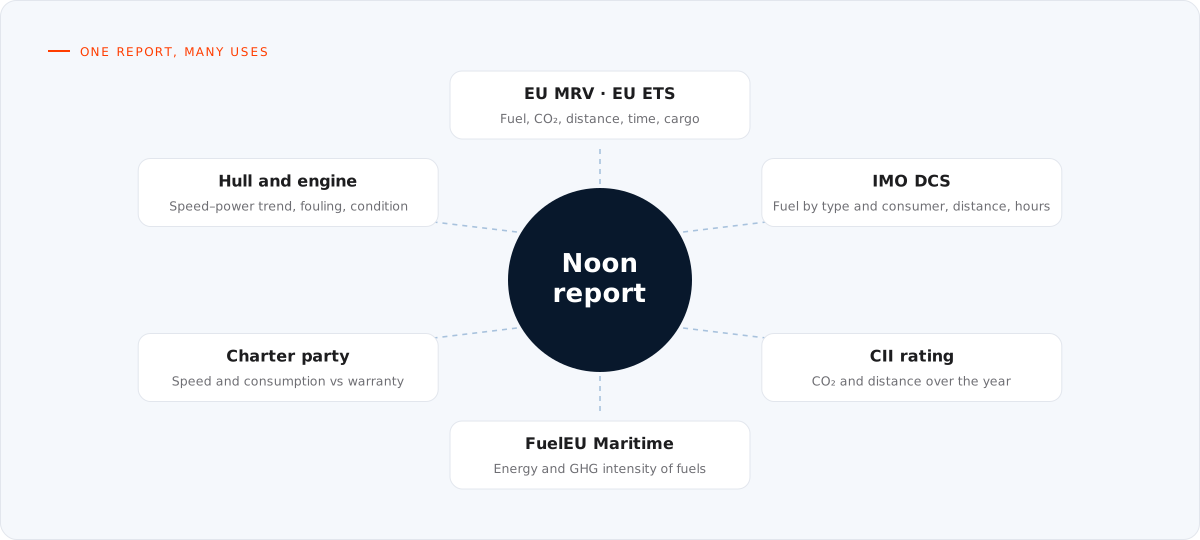
Figure 1. The same daily figures feed regulatory reporting (EU MRV and ETS, IMO DCS, FuelEU Maritime), the vessel's CII rating, charter party performance and technical performance analysis.
Each of these uses looks at the same figures from a different angle. The verifier wants fuel, distance and time that reconcile with bunker delivery notes and tank soundings. The charterer wants speed and consumption in the weather conditions the charter party defines. The technical superintendent wants shaft power, RPM and draught to follow hull fouling and engine condition. The commercial team wants the year's CO₂ and distance to know where the CII rating will land.
When the report is weak, each of these users fixes it in their own spreadsheet. The result is several versions of the same voyage, none of them traceable to what was recorded on board. The aim of good noon reporting is the opposite: one set of figures, captured once, at the source, with enough context that every later user can rely on it.
2. Anatomy of a noon report
A noon report is easiest to get right when it is treated as four blocks, each owned by one officer, rather than as one long form.
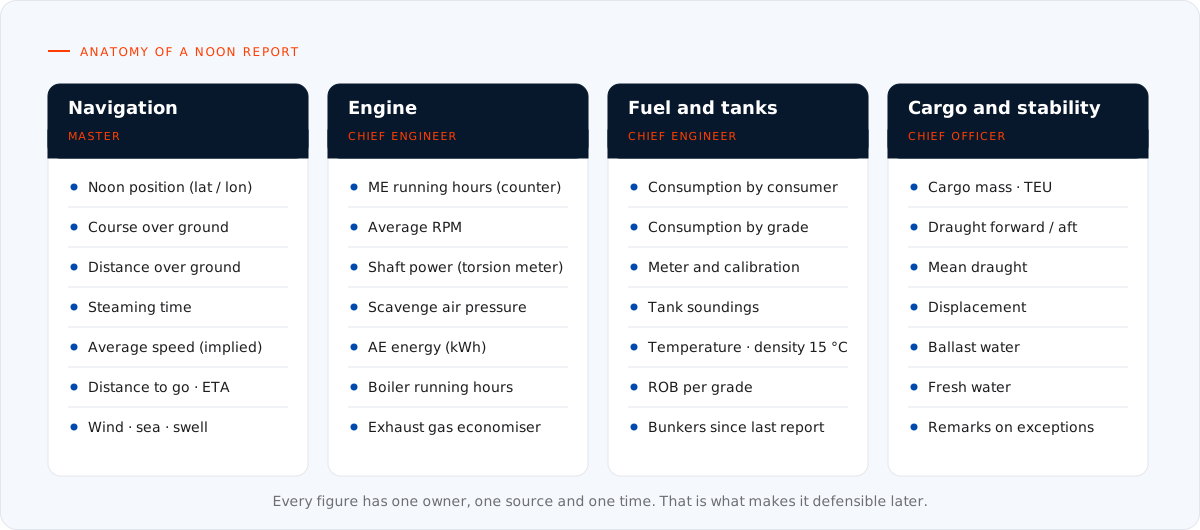
Figure 2. The four blocks of a noon report and their owners. Splitting the report by owner makes it clear who enters, checks and answers for each figure.
| Block | Owner | Core parameters | Main uses |
|---|---|---|---|
| Navigation | Master | Noon position, course over ground, distance over ground, steaming time, average speed, distance to go, ETA, wind, sea and swell | Distance for CII and MRV, speed for charter party, weather for performance claims |
| Engine | Chief Engineer | Main engine running hours, average RPM, shaft power, scavenge air pressure, auxiliary engine energy, boiler running hours, exhaust gas economiser status | Engine condition, speed–power analysis, consumption plausibility |
| Fuel and tanks | Chief Engineer | Consumption by consumer and by grade, meter and calibration reference, tank soundings, temperature, density, ROB per grade, bunkers received | Emissions, ROB reconciliation, FuelEU energy, bunker planning |
| Cargo and stability | Chief Officer | Cargo mass or TEU, draught forward and aft, mean draught, displacement, ballast water, fresh water | Transport work for MRV, speed–power at the right displacement, charter party conditions |
Two parameters deserve attention because they are often missing. Shaft power from a torsion meter is the single most useful number for performance analysis: without it, every speed–consumption comparison mixes engine efficiency, hull condition and weather into one figure. Displacement or mean draught is needed to compare one day with another, since the same speed at a deeper draught needs more power.
3. Navigation: distance and time first
Most noon report errors that matter downstream are not about fuel. They are about distance and time.
Distance over ground, taken from the track log between two noon positions, is the figure used for CII, IMO DCS and EU MRV. Distance through the water is useful for performance analysis, but it is a different quantity and should be recorded as such, never substituted.
Steaming time is the time the ship was actually under way since the last report. Noon to noon is not always 24 hours: clock changes when crossing time zones make a "day" 23 or 25 hours, and a report after departure or before arrival covers a part day. Recording every report with both ship's local time and UTC removes the ambiguity, and lets shore add up time correctly over a voyage.
Average speed should be checkable rather than typed. Distance over ground divided by steaming time gives the implied speed over ground; if the reported average speed does not agree with it within a small tolerance, one of the three figures is wrong. That single check catches most transcription errors before they reach any regulatory report.
Weather (wind force and direction, sea state, swell) belongs in the navigation block because charter party performance clauses usually exclude days above a stated wind force or sea state. Recording it as observed, at the time of the report, is what allows those days to be identified later.
4. Engine: the parameters that explain the fuel
The engine block exists to explain the fuel figure. A day's consumption that cannot be explained by power, speed, draught and weather is a figure to question, whatever the meters say.
- Main engine running hours are best taken from the counter rather than typed as a duration. The counter must move by roughly the steaming time, and no more.
- Average RPM and shaft power give the engine's operating point. With speed and draught, they allow speed–power curves to be followed over time, which is how hull and propeller fouling becomes visible.
- Scavenge air pressure is a simple indicator of turbocharger and engine condition when compared at similar loads.
- Auxiliary engine energy (kWh) and boiler running hours explain the non-propulsion consumption, which matters for both emissions reporting and the CII correction factors described in section 7.
- Exhaust gas economiser in service explains why boiler consumption may drop to nothing at sea.
5. Fuel: measure, reconcile, convert
5.1 Consumption by consumer and by grade
Fuel is recorded per consumer (main engine, auxiliary engines, boilers, inert gas generator, other) and per grade (for example HFO, VLSFO, MGO, LNG). Both splits are now needed: emissions factors depend on the grade, and regulatory reports increasingly ask for consumption by consumer category.
Each figure should carry its monitoring method. Under the EU MRV Regulation, a ship's monitoring plan specifies one of four methods for each emission source:
| Method | Basis |
|---|---|
| A | Bunker delivery notes and periodic stocktakes of fuel tanks |
| B | Bunker fuel tank monitoring on board |
| C | Flow meters on the combustion process |
| D | Direct measurement of emissions |
Where flow meters are used, the meter identity and its calibration certificate are part of the evidence. A figure from an uncalibrated meter is still a figure, but it should be visibly marked as such.
5.2 From a sounding to tonnes
Tank soundings give a volume, not a mass. Converting them correctly matters, because the difference between observed and standard volume for a heated heavy fuel tank can be several per cent.
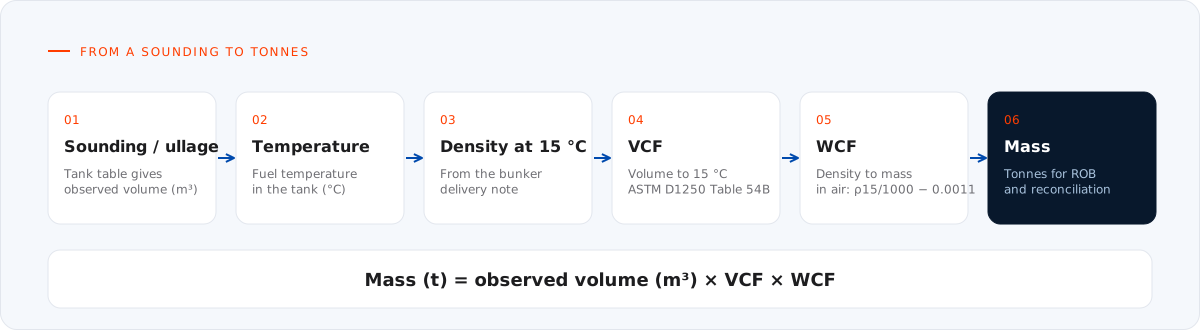
Figure 3. A sounding or ullage gives the observed volume from the tank calibration table. The volume correction factor (VCF) brings it to 15 °C using the fuel temperature and the density at 15 °C from the bunker delivery note; the weight correction factor (WCF) converts volume to mass in air.
The VCF for fuel oils comes from ASTM D1250 (API MPMS Chapter 11.1), Table 54B. The WCF for mass in air is the density at 15 °C in kg/m³ divided by 1,000, less 0.0011. Doing the conversion the same way on every ship, from recorded inputs, means a superintendent can recompute any tank's mass from the report alone.
5.3 Reconciling ROB
The remaining on board (ROB) figure ties the report together. For each grade:
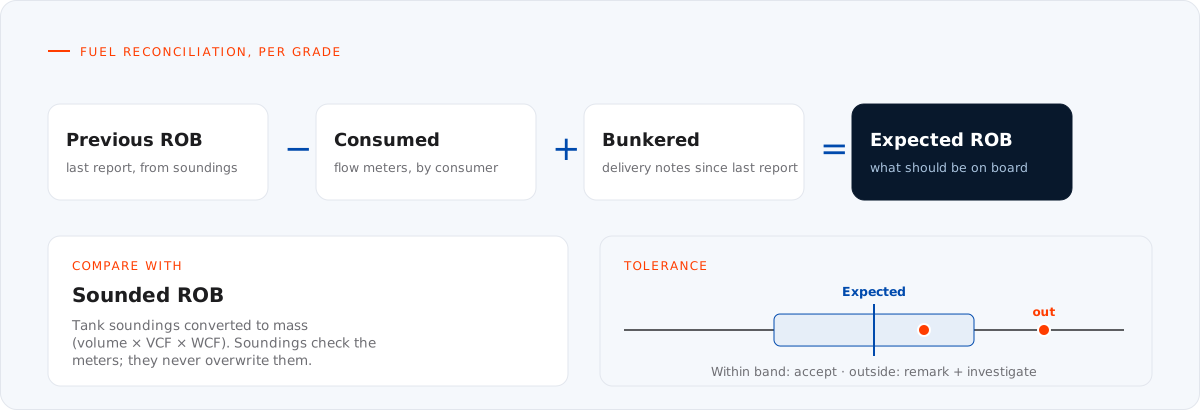
Figure 4. Expected ROB is the previous ROB less fuel consumed plus fuel bunkered since the last report. It is compared with the ROB found by sounding the tanks, within a tolerance set by company policy.
Two principles keep reconciliation honest:
- Soundings check the meters; they do not overwrite them. If the reconciliation is out, the difference is investigated and explained. Quietly adjusting consumption to make the ROB agree removes the one signal that something is wrong: a leaking valve, an uncalibrated meter, a sounding error, or an unrecorded transfer.
- The tolerance is a written policy, not a feeling. A common form is "the greater of a fixed quantity or a percentage of the consumption since the last report", for example the greater of 1.0 t or 2 %. Inside the band, the figures are accepted. Outside it, the report needs a remark from the Chief Engineer before it can be signed.
Internal transfers between tanks belong in the same picture. Per tank, the expected mass is the previous mass plus transfers in, less transfers out, less consumption drawn from that tank. Recording transfers as events, with time and quantity, is what makes tank-level reconciliation possible.
5.4 From fuel to CO₂
CO₂ is calculated from the mass of each fuel multiplied by its carbon factor (Cf), in tonnes of CO₂ per tonne of fuel. The IMO factors for the common fuels are:
| Fuel | Cf (t CO₂ / t fuel) |
|---|---|
| Heavy fuel oil (HFO) | 3.114 |
| Light fuel oil (LFO) | 3.151 |
| Diesel / gas oil (MDO / MGO) | 3.206 |
| LNG | 2.750 |
Illustrative example. A day in which the main engine burns 28.0 t of HFO and the auxiliary engines 3.0 t of MGO produces 28.0 × 3.114 + 3.0 × 3.206 = 87.2 + 9.6 = 96.8 t of CO₂. Every input to that sum (fuel mass, grade, factor and the factor set's version) should be visible on the report, so the calculation can be repeated by anyone who reads it.
6. From daily figures to annual indicators
6.1 CII
The Carbon Intensity Indicator under MARPOL Annex VI Regulation 28 rates a ship's operational carbon intensity over each calendar year. For bulk carriers, tankers and container ships it is calculated as the annual efficiency ratio:
Attained CII = annual CO₂ (g) ÷ (deadweight × distance sailed in nautical miles)
The required CII for the year is the reference value for the ship type and size, reduced by a factor Z: 5 % for 2023, 7 % for 2024, 9 % for 2025 and 11 % for 2026, relative to the 2019 reference line. The attained value is then compared with the required value to give a rating from A to E.
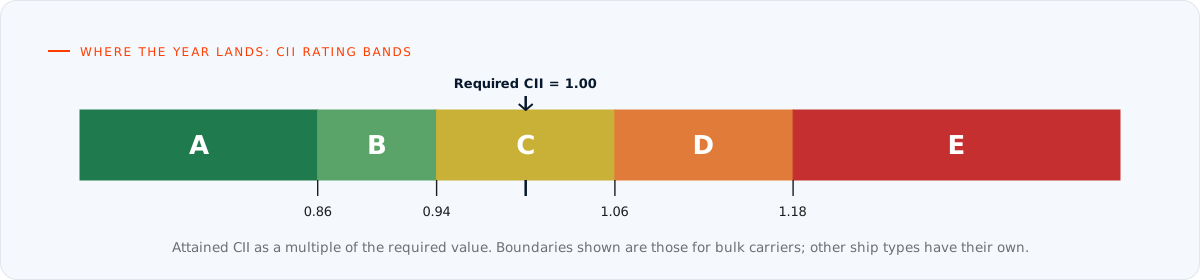
Figure 5. Rating bands are set as multiples of the required CII. The boundaries shown are those for bulk carriers; each ship type has its own. A ship rated D for three consecutive years, or E in any year, must submit a corrective action plan.
Illustrative example. A 60,000 dwt bulk carrier that emits 20,000 t of CO₂ over 70,000 nm in a year has an attained CII of 20,000 × 10⁶ ÷ (60,000 × 70,000) = 4.76 g CO₂ per dwt·nm. Whether that is an A or a D depends on the ship's required value for the year; the point is that the two inputs, CO₂ and distance, are both sums of noon report figures. An error in either, repeated daily, moves the rating.
Because the rating is annual, the noon report is also the best early warning. Summing the year to date and projecting the remaining voyages shows where the year is heading while there is still time to act on speed, routing or hull cleaning.
6.2 EU MRV and the EU ETS
Under the EU MRV Regulation (EU) 2015/757, emissions are reported per voyage and at berth. Emissions on voyages between two EU ports and at berth in EU ports are covered in full; voyages between an EU port and a port outside the EU are covered at 50 %. The same scope applies to the EU Emissions Trading System for shipping, where companies surrender allowances for 40 % of their 2024 verified emissions, 70 % for 2025 and 100 % from 2026.
For the noon report, this means two things. First, port calls and the start and end of sea passages must be recorded as events with exact times, because they decide which emissions fall into which scope. Second, fuel and emissions at berth need to be separable from those at sea.
6.3 FuelEU Maritime
FuelEU Maritime, Regulation (EU) 2023/1805, limits the greenhouse gas intensity of the energy used on board, measured well-to-wake in grams of CO₂ equivalent per megajoule. The reference value is 91.16 gCO₂e/MJ, and the limit tightens over time:
| From | Reduction below reference |
|---|---|
| 2025 | 2 % |
| 2030 | 6 % |
| 2035 | 14.5 % |
| 2040 | 31 % |
| 2045 | 62 % |
| 2050 | 80 % |
The calculation starts from the same fuel masses by grade, converted to energy with each fuel's lower calorific value. A deficit against the limit carries a penalty of €2,400 per tonne of VLSFO-equivalent energy, taken as 41,000 MJ per tonne. Fuel grade, mass and the fuel's certified properties on the bunker delivery note therefore carry a direct cost.
7. Events between reports
Some of the most consequential data is not in the daily report at all, but in what happened between two reports. These should be recorded as separate events, each with time, position and its own fuel where relevant:
- Departure and arrival: commencement and end of sea passage
- Bunkering, with the delivery note reference, grade, quantity and density
- Transfers between tanks
- Fuel changeover, for example on entering an emission control area
- Deviation from the planned route, and its reason
- Canal transits
- Ship-to-ship operations
- Navigation in ice
- Cargo heating
- Deviation for safety or search and rescue
Several of these matter beyond the voyage record. The IMO guidelines on CII correction factors and voyage adjustments allow some fuel and distance, such as that used for navigation in ice, for safety or search and rescue, for cargo heating or for ship-to-ship operations, to be adjusted for in the calculation. That is only possible if the event and its consumption were recorded at the time, separately from normal steaming.
8. Five checks before the Master signs
A noon report should be checked on board before it is sent, not corrected by shore afterwards. Five checks catch most problems.
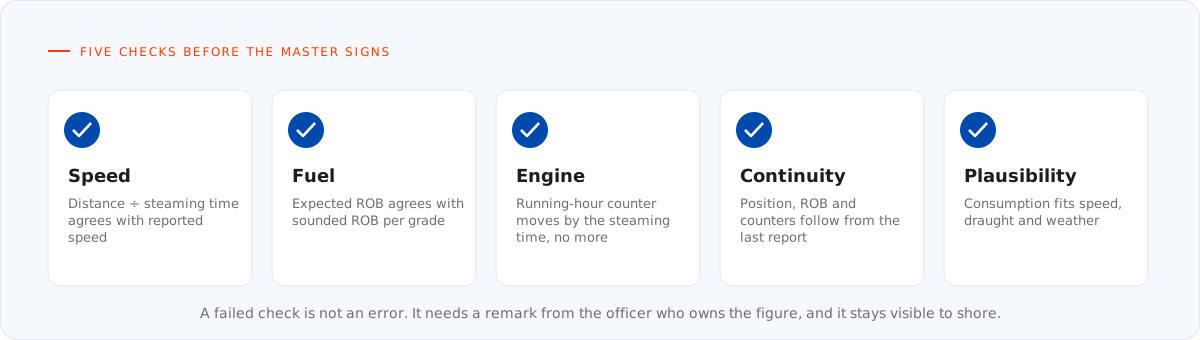
Figure 6. Five checks every noon report should pass. A check that fails is not an error in itself: it needs a remark from the officer who owns the figure, and the remark stays visible to shore.
- Speed. Distance over ground divided by steaming time agrees with the reported average speed. Illustrative example: 336 nm in 24.0 hours is 14.0 knots. A reported speed of 14.6 knots is 4.3 % higher. With a tolerance of 3 %, the report needs a remark or a correction.
- Fuel. Expected ROB agrees with sounded ROB for each grade, within the written tolerance.
- Engine. The main engine running-hour counter has moved by the steaming time, and not by more.
- Continuity. Position, ROB and counters follow on from the previous report. A report that starts from different numbers than the last one ended with has lost something in between.
- Plausibility. Consumption fits the speed, draught and weather. A large change in consumption at the same speed and draught is a question to ask while the ship is still at sea.
The discipline that makes these checks useful is the remark. When a check fails and the figure is nevertheless correct, the owner of the figure says why, in words, before the report can be signed. A short, specific remark ("ME consumption high: heavy weather, BF 8 from 0400") is worth more later than any number of corrected figures.
9. The chain of evidence
Verifiers, charterers and port state control inspectors increasingly ask not just what a figure is, but where it came from. Good noon reporting answers that question for every figure.
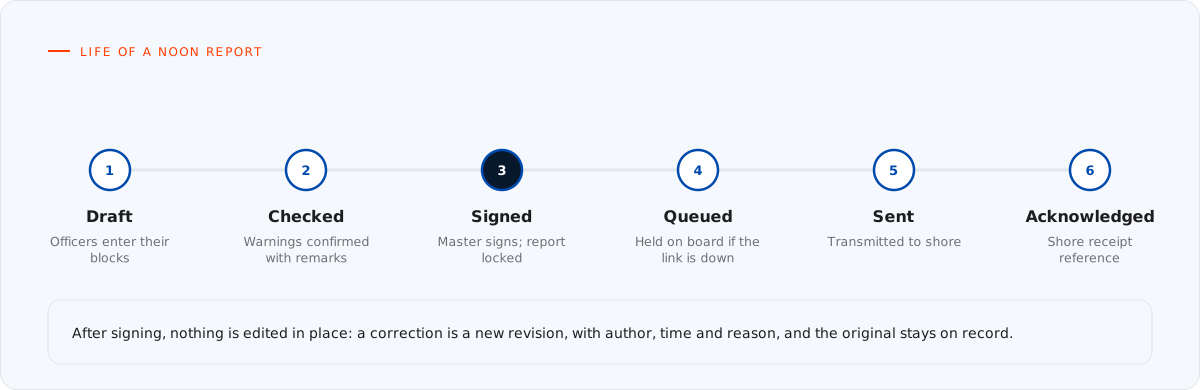
Figure 7. A report moves from draft to checked to signed. Signing locks it. It is then queued, sent and acknowledged by shore. After signing, a correction is a new revision with its author, time and reason; the original remains on record.
Five practices make the chain hold:
- One owner per figure. Each block is entered and answered for by the officer responsible for it, and the Master signs the whole.
- Signing locks the report. Once signed, a report is not edited in place. A cryptographic fingerprint of the signed content, recorded at signing, makes any later change detectable.
- Corrections are revisions. If shore finds an error, the correction is a new revision that records who changed what, when and why. The original stays readable. Verifiers expect to see this history; a report that silently changes is harder to defend than one with a documented correction.
- Nothing is lost when the link is down. Reports are signed and stored on board, then queued and sent when communications return, in order. Shore acknowledges each one with a receipt reference, so both sides know which reports have arrived.
- Every calculated figure shows its working. For distance sailed, voyage CO₂, CII or ROB, the source data, the method, the factor set and the time of calculation should be one step away from the number itself.
10. A checklist for the office
For a technical or fleet manager reviewing their own noon reporting, these questions are a practical starting point:
- Is each parameter in the report owned by a named rank, and is the report signed by the Master?
- Are distance over ground and steaming time recorded, with times in both local time and UTC?
- Is consumption recorded by consumer and by grade, with the monitoring method and meter for each?
- Are tank soundings converted to mass the same way on every ship, from recorded temperature and density?
- Is ROB reconciled per grade against a written tolerance, and are exceptions explained rather than adjusted away?
- Are bunkering, transfers, fuel changeovers and voyage events recorded as separate, timed entries?
- Are shaft power and draught captured, so speed–consumption figures can be compared like with like?
- Can every figure in your EU MRV, IMO DCS, CII and FuelEU reports be traced back to a signed noon report and its revisions?
A "no" to any of these is where the next year's reporting effort, and the next dispute, will be spent.
Conclusion
The noon report is no longer an operational courtesy. It is the evidence behind a ship's emissions reports, its carbon rating, its allowance costs and its performance claims. Treating it that way does not require more fields so much as better ones: figures owned by the officer who produces them, fuel reconciled rather than adjusted, events recorded when they happen, checks run before signing, and a record that shows its own history. Ships that report this way spend less time defending their numbers and more time acting on them.
References and further reading
- IMO, MARPOL Annex VI, Regulation 27 (fuel oil consumption data collection) and Regulation 28 (operational carbon intensity).
- IMO, Resolution MEPC.338(76), reduction factors for the CII relative to the 2019 reference line.
- IMO, Resolution MEPC.353(78), guidelines on the reference lines for use with operational carbon intensity indicators.
- IMO, Resolution MEPC.354(78), guidelines on the operational carbon intensity rating of ships.
- IMO, Resolution MEPC.355(78), interim guidelines on correction factors and voyage adjustments for CII calculations.
- IMO, Resolution MEPC.364(79), guidelines on the method of calculation of the attained EEDI, including carbon factors.
- Regulation (EU) 2015/757 on the monitoring, reporting and verification of CO₂ emissions from maritime transport, as amended.
- Directive 2003/87/EC establishing the EU Emissions Trading System, as amended by Directive (EU) 2023/959.
- Regulation (EU) 2023/1805 on the use of renewable and low-carbon fuels in maritime transport (FuelEU Maritime).
- ASTM D1250 / API MPMS Chapter 11.1, petroleum measurement tables, Table 54B.
Related papers: Maintenance as an efficiency lever: hull, propeller and engine performance under CII and Measuring maintenance performance: KPIs that tell the truth about a ship's PMS.