Summary
Every ship manager reports maintenance numbers. Few of those numbers say much about how well the ships are actually maintained. "Zero overdue jobs" can mean an excellent crew, or postponements approved too easily, or jobs closed without the work being done. A useful set of key performance indicators (KPIs) has to be calculated consistently, balanced between leading and lagging measures, and designed so that the easiest way to improve the number is to improve the maintenance.
This paper proposes a compact KPI set for shipboard maintenance, shows how to calculate each indicator from Planned Maintenance System (PMS) data, and explains how to read and protect them.
1. What makes a good maintenance KPI
A good indicator is:
- Defined precisely: numerator, denominator, period and exclusions written down, so two vessels or two years can be compared.
- Calculated from system data, not compiled by hand.
- Actionable: someone can do something about it.
- Hard to game: improving the number without improving the maintenance should be difficult or visible.
- Part of a balanced set: no single KPI should be read alone.
The European standard EN 15341 (Maintenance — Maintenance Key Performance Indicators) provides a structured framework of maintenance indicators across economic, technical and organisational dimensions. For shipping, BIMCO's Shipping KPI standard defines performance indicators across ship management, several of which relate to technical performance, and allows benchmarking between managers. Both are useful references when defining a company's own set.
2. Leading and lagging indicators
Lagging indicators measure outcomes: failures, downtime, detentions, costs. They are what matters, but they arrive late and are influenced by luck.
Leading indicators measure the activities and conditions that produce good outcomes: work done on time, critical equipment tested, data recorded properly. They can be acted on before an outcome occurs.
A balanced set uses both. Improvements in leading indicators should, over time, show up in lagging ones. If they do not, the leading indicators are measuring the wrong things or are being gamed.
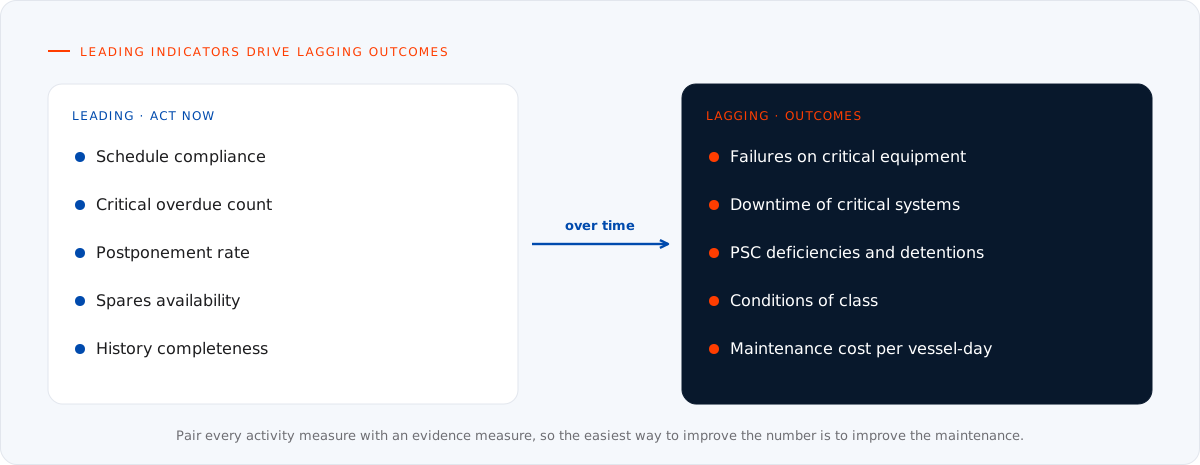
Figure 1. Leading indicators are the levers; lagging indicators are the results.
3. A core KPI set for ship maintenance
Execution
| KPI | Calculation | What it shows |
|---|---|---|
| Schedule compliance | Jobs completed within their due window ÷ jobs due in the period | Whether planned work is done when planned |
| Overdue ratio | Jobs overdue at period end ÷ active planned jobs | Size of the slippage |
| Critical overdue count | Overdue jobs on critical equipment and class items | The overdue work that matters most; target zero |
| Postponement rate | Jobs postponed in the period ÷ jobs due | How often the schedule is renegotiated |
| Backlog | Estimated labour hours of outstanding work ÷ available crew maintenance hours per week | Weeks of work waiting; a rising backlog signals under-resourcing |
Work mix
| KPI | Calculation | What it shows |
|---|---|---|
| Planned to corrective ratio | Labour hours on planned work ÷ hours on corrective work | Whether maintenance is proactive or reactive |
| Breakdown share | Corrective jobs from unplanned failures ÷ all corrective jobs | How much corrective work arrives as a surprise |
| Detection effectiveness | Defects found by inspection or condition monitoring ÷ all defects | Whether the strategy catches problems before failure |
Reliability
| KPI | Calculation | What it shows |
|---|---|---|
| Failures on critical equipment | Count per vessel per year | The core safety outcome |
| MTBF by equipment class | Operating time ÷ number of failures | Reliability trend; needs coded failure data (paper 05) |
| Repeat failures | Failures recurring on the same item within a set period | Quality of repairs and root-cause analysis |
| Downtime of critical systems | Hours unavailable | Operational impact |
Spares and cost
| KPI | Calculation | What it shows |
|---|---|---|
| Spares availability | Jobs started with all parts on board ÷ jobs started | Planning and stock policy (paper 06) |
| Emergency orders | Count and cost of urgent requisitions | Gaps in planning |
| Maintenance cost per vessel per day | Spares, services and repairs ÷ days in period | Spend, comparable across a fleet of similar ships |
External outcomes
| KPI | Calculation | What it shows |
|---|---|---|
| Port state control deficiencies related to maintenance | Count per inspection | External view of condition |
| Detentions | Count | The most visible failure of the system |
| Conditions of class | Number outstanding | Class view of condition |
| Vetting observations related to maintenance | Count per inspection | Charterer and terminal view |
Data quality
| KPI | Calculation | What it shows |
|---|---|---|
| History completeness | Completed jobs with findings, hours and signature ÷ completed jobs | Whether the record is evidence or ticks |
| Failure coding rate | Failures with full coding ÷ failures | Whether reliability analysis is possible |
| Counter update timeliness | Counters updated within the set period ÷ counters | Accuracy of running-hour scheduling |
Not every fleet needs every indicator. A practical starting point is about eight to ten, covering each group, with a few reviewed monthly and the rest quarterly.
4. Definitions that prevent arguments
Most disputes about KPIs are disputes about definitions. Decide and document:
- The due window. Is a monthly job done three days late compliant? Set an explicit tolerance per interval type, for example a percentage of the interval.
- Postponed jobs. Are approved postponements counted as overdue? Report them separately rather than hiding them.
- Which jobs count. Exclude jobs for equipment not in use (laid-up, removed) using a recorded status, not by deleting them.
- Running-hour jobs. Measure compliance against the hour limit, which requires accurate counters.
- Period and snapshot. State whether a figure is a snapshot at period end or a total over the period.
5. How KPIs get gamed, and how to stop it
Any indicator tied to reward will be optimised. The common patterns in maintenance are well known:
| Gaming pattern | Symptom | Countermeasure |
|---|---|---|
| Closing jobs without doing them | Very high compliance, thin history records, spares not consumed | Track history completeness and spares consumption against jobs closed |
| Postponing instead of reporting overdue | Low overdue ratio, high postponement rate | Report postponements beside overdue; require approval for critical items |
| Batch closing before audits | Many jobs closed on the same day | Monitor completion date distribution |
| Lengthening intervals quietly | Fewer jobs due, compliance improves | Interval changes only through management of change, with an audit trail |
| Not recording failures | Reliability appears to improve | Cross-check with requisitions, defect reports and log books |
The underlying principle is to pair every activity indicator with an evidence indicator. Compliance means little without history completeness; low overdue counts mean little without postponement rates.
6. From numbers to decisions
KPIs are only valuable if they change what people do:
- Fleet review meetings should look at trends, not single values, and at the worst performers, not averages.
- Vessel comparisons should be like for like: similar ship types, ages and trading patterns.
- Each red indicator needs an owner and an action, recorded and followed up.
- Crews should see their own numbers and how they compare, with an explanation of why each matters.
- Indicators should be reviewed annually. Retire those that no longer drive decisions; add those that new risks require.
7. What the PMS must provide
All of the above can be calculated automatically if the PMS records:
- due dates, windows and completion dates for every job;
- postponements with reason, approver and new limit;
- labour hours, distinguishing planned and corrective work;
- criticality and class flags on equipment and jobs;
- failures with coded mode and cause;
- spares consumption linked to jobs;
- running-hour counters with update dates.
Where these fields are missing, the KPI set will show it immediately, which is itself useful: the first value of a KPI programme is often to reveal what the data cannot yet support.
Conclusion
Maintenance KPIs should make the state of the fleet visible, honestly and early. A balanced, precisely defined set that pairs activity with evidence, leading with lagging indicators, and is calculated straight from PMS data gives management a reliable picture and gives crews a fair one. Built on clean data, it becomes the basis for every improvement described in this series.
References and further reading
- CEN, EN 15341: Maintenance — Maintenance Key Performance Indicators.
- BIMCO, Shipping KPI Standard.
- International Maritime Organization, International Safety Management (ISM) Code, sections 10 and 12.
- Companion papers: 02 Intervals and class, 04 RCM and CBM, 05 Master data and 06 Spare parts.
Want KPIs you can trust? We structure PMS data so that maintenance indicators can be calculated automatically and consistently across a fleet. See our Planned Maintenance System services.