Summary
Every ship manager wants the same answers from maintenance data. Which equipment fails most across the fleet? Which makers and models cost the most to maintain? Are intervals right? Is condition monitoring paying off? In most fleets these questions cannot be answered, not because the data was never recorded, but because it was recorded in ways that cannot be compared.
This paper sets out how to design Planned Maintenance System (PMS) master data so that it supports fleet-wide analysis: the structure of the hierarchy, the separation of function from physical asset, the use of coding standards, failure coding, and the governance that keeps the data clean over time.
1. Why fleet analytics usually fail
The same patterns appear in fleet after fleet:
- Inconsistent naming. One ship records "ME T/C", another "Main Engine Turbocharger", a third the turbocharger's type designation. Software cannot tell they are the same thing.
- Mixed levels. Some ships break a purifier into bowl, drive and motor; others record it as one item. Counts and costs are not comparable.
- Free text where codes belong. Failure causes, actions and findings live in remarks fields that can be read but not analysed.
- Lost history on exchange. When a turbocharger, fuel pump or injector set is exchanged for an overhauled unit, its history stays with the position or disappears, depending on how the system was set up.
- Maker and model variants. The same maker appears under several spellings and historical company names, so maker-level analysis splits into fragments.
Each problem is cheap to prevent when the data is designed and expensive to fix afterwards.
2. Function and asset are not the same thing
Mature enterprise asset management systems separate two ideas that many PMS databases merge:
- A functional location is a position in the ship that performs a function: "No. 2 auxiliary engine turbocharger", "Main sea water pump No. 1". It belongs to the ship and stays there.
- A physical asset is a specific, serialised unit installed at that position: a turbocharger of a given type with a given serial number. It can be removed, overhauled ashore and installed on another ship.
Separating them gives two complete histories:
| Question | Answered by |
|---|---|
| How reliable is this position on this ship, whatever unit is fitted? | History of the functional location |
| How reliable is this particular unit wherever it has been? | History of the physical asset |
| Which units are in the overhaul pool, and where is each one now? | Installation records linking assets to locations |
For most fixed equipment the distinction is invisible: the same unit stays in place for its life. It matters for rotables and exchange units such as turbochargers, fuel injection pumps, injectors, cylinder heads, electric motors and pumps overhauled ashore. For these, a PMS that cannot follow the serial number cannot answer the most useful reliability questions.
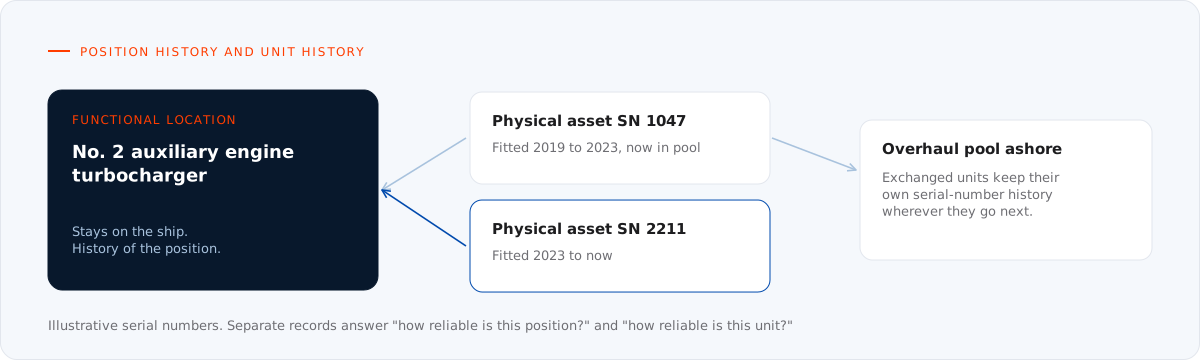
Figure 1. Separating the position on board from the serialised unit fitted there gives two complete histories.
3. Two standards that work together
SFI for where and what function
The SFI Group System organises a ship by function: main groups, groups and sub-groups. It is the natural backbone for the functional hierarchy on a ship and is widely understood by yards, owners and suppliers. Our article on the SFI Group System explains its structure.
ISO 14224 for what kind of equipment and how it fails
ISO 14224 (Petroleum, petrochemical and natural gas industries — Collection and exchange of reliability and maintenance data for equipment) was written for the oil and gas industry, but its principles transfer well to ships. It defines a nine-level taxonomy:
| Level | Taxonomy level | Purpose |
|---|---|---|
| 1 | Industry | Use and location |
| 2 | Business category | Use and location |
| 3 | Installation category | Use and location |
| 4 | Plant or unit category | Use and location |
| 5 | Section or system | Use and location |
| 6 | Equipment class or unit | Equipment subdivision |
| 7 | Subunit | Equipment subdivision |
| 8 | Component or maintainable item | Equipment subdivision |
| 9 | Part | Equipment subdivision |
Levels 1 to 5 describe where equipment is used; levels 6 to 9 break the equipment itself down. For a ship, SFI covers the "where and what function" levels; an ISO 14224-style equipment class and subunit breakdown covers "what kind of equipment".
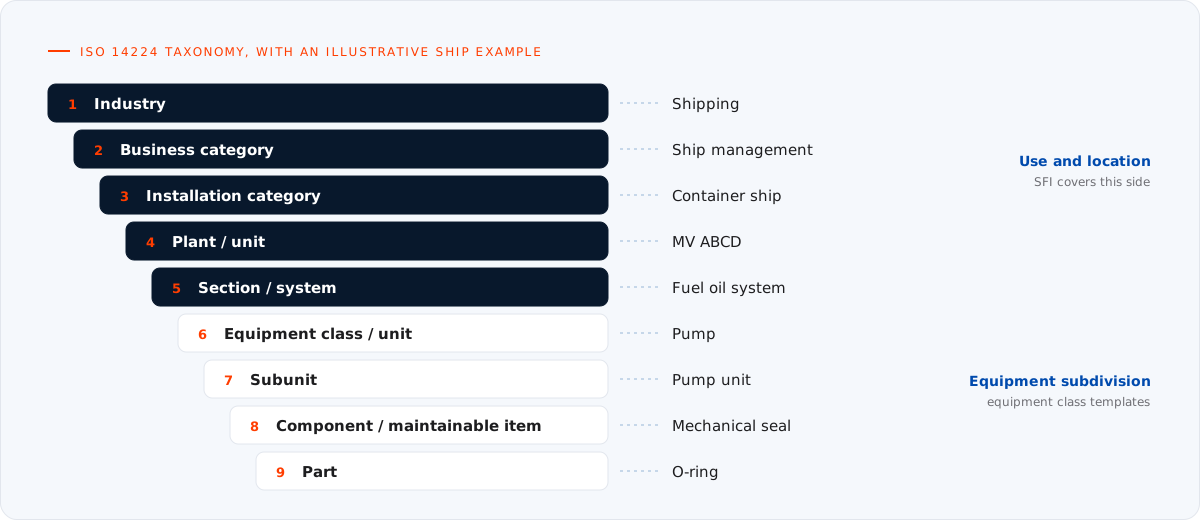
Figure 2. The ISO 14224 taxonomy applied to a ship (illustrative example).
The standard also defines equipment classes (for example pumps, compressors, electric motors, combustion engines) with standard boundaries, so it is clear whether a pump's driver, coupling and instrumentation are counted as part of the pump. Agreeing boundaries is what makes failure rates comparable.
4. Equipment classes and templates
The most effective way to keep a fleet consistent is to build templates at the class and model level and create each ship's equipment from them:
- Equipment class: for example "centrifugal pump", with a standard attribute set (maker, model, capacity, head, speed, driver rating) and a standard subunit breakdown.
- Maker and model template: the class template filled in for a specific model, with the maker's job library, intervals and spare parts list from its instruction book (see paper 01).
- Ship instance: the template applied to a functional location on a ship, with the serial number, installation date and location added.
Templates turn hundreds of independent records into a few hundred controlled ones. When a maker issues a service letter, the change is made once at template level and pushed to every ship that has the model. When a new ship joins the fleet, most of its PMS can be assembled from existing templates and verified rather than built from scratch.
Reference tables
Templates only work if the values inside them are controlled. Maintain fleet-wide reference tables for:
- makers, with one approved name per company and its historical names mapped to it;
- models and types, linked to their maker;
- units of measure for attributes and counters;
- criticality levels, including the ISM Code critical-equipment flag;
- class survey items, so continuous-survey status can be tracked.
5. Failure and work coding
Analysis needs codes, not sentences. ISO 14224 provides code lists for describing failures. Adopting that structure, or a simplified version of it, turns each failure record into usable data:
| Field | Describes | Example values |
|---|---|---|
| Failure mode | The observed effect on the equipment | Fail to start on demand, external leakage, abnormal vibration, overheating |
| Failure mechanism | The physical process that led to the failure | Wear, fatigue, corrosion, erosion, blockage |
| Failure cause | Why it happened | Design, fabrication or installation, operation, maintenance, management |
| Detection method | How it was found | Periodic maintenance, condition monitoring, operator observation, on demand |
| Maintenance activity | What was done | Replace, repair, modify, adjust, overhaul, check |
| Downtime and effort | The impact | Hours out of service, labour hours, spares used |
ISO 14224 publishes standard codes for failure modes by equipment class, for example "fail to start on demand" (FTS), "external leakage — process medium" (ELP), "vibration" (VIB) and "overheating" (OHE) for rotating equipment. Using recognised codes means the data can be compared with other sources and remains meaningful when the PMS changes.
Coding does not replace remarks. Engineers should still describe what they found; the codes make the record countable.
6. The metrics this unlocks
With consistent hierarchy, classes and failure codes, standard reliability metrics become possible at fleet level:
- Mean time between failures (MTBF): total operating time of a population divided by the number of failures in that period. Calculated per equipment class, model or position.
- Mean time to repair (MTTR): average time to restore function after failure.
- Inherent availability: MTBF ÷ (MTBF + MTTR), the proportion of time the equipment can perform its function when only corrective maintenance is considered.
- Bad-actor analysis: a Pareto ranking of equipment by number of failures, downtime or cost, which usually shows a small share of equipment driving most of the trouble.
- Maintenance cost by SFI group: where the money goes, comparable between sister ships and classes of vessel.
- Detection effectiveness: the share of failures caught by condition monitoring or planned inspection rather than by breakdown, a direct measure of whether the maintenance strategy works.
These metrics are the evidence base for the interval reviews and condition-based strategies described in papers 02 and 04.
7. Governance: keeping it clean
Master data degrades unless someone owns it. Effective governance includes:
- Defined ownership. A fleet data steward in the technical department owns templates and reference tables; ships propose changes, the office approves them.
- Controlled entry. Pick-lists and reference tables instead of free text for makers, models, classes and codes.
- Management of change. Changes to templates, criticality and class items go through a documented approval, like any other technical change.
- Validation rules. Mandatory fields, unit checks and duplicate detection at the point of entry.
- Data quality measures, reviewed regularly: completeness of mandatory attributes, duplicate rate, share of jobs with a source reference, share of failures with full coding.
ISO 8000 addresses data quality and ISO 55000 asset management in general; both are useful references when writing a fleet data policy.
8. Where to start
- Agree the target structure: SFI version and depth, equipment classes, boundaries and code lists.
- Build reference tables for makers, models, units and criticality.
- Create templates for the most common equipment classes and models in the fleet.
- Map each ship to the target structure, separating functional locations from serialised rotables.
- Introduce failure coding in the PMS, with short training for engineers.
- Publish the first fleet reports (bad actors, MTBF by class, cost by SFI group) and use them in technical reviews, so the crews see the data being used.
Conclusion
Fleet analytics are a master data problem before they are a software problem. A hierarchy that separates function from asset, standard equipment classes and templates, coded failures and a named owner for the data turn a collection of ship databases into a fleet-wide source of evidence. That evidence is what allows intervals, spares and strategies to be improved with confidence.
References and further reading
- ISO 14224, Petroleum, petrochemical and natural gas industries — Collection and exchange of reliability and maintenance data for equipment.
- ISO 55000 series, Asset management.
- ISO 8000 series, Data quality.
- SFI Group System: see our article The SFI Group System.
- Companion papers: From instruction book to job library, Migrating PMS data between systems and Reliability-centred and condition-based maintenance.
Structuring PMS data across a fleet? We design hierarchies, templates and reference data and map each vessel to them, ready for import into your PMS. See our Planned Maintenance System services.