Summary
Spare parts sit at the centre of a hard trade-off. Too few, and a ship waits for a part while its schedule, charter and reputation suffer. Too many, and capital is tied up in stores that slowly become obsolete, take up space on board and still fail to include the one part that is needed. Most fleets manage this trade-off with experience and habit, which works until the fleet grows, the crew changes or the market tightens.
This paper sets out a quantitative approach: classify parts by what matters, forecast demand from the Planned Maintenance System (PMS) where it is known, model it statistically where it is not, and set stock levels with explicit service targets.
1. Why ships are a special case
The standard textbook inventory model assumes frequent, regular demand and a supplier a short drive away. A ship breaks most of those assumptions:
- Effective lead time is long and variable. It is not the supplier's delivery time but the time until the part can reach the ship, which depends on the port rotation, customs and agents.
- Demand is lumpy. Many parts are used rarely and in irregular quantities.
- Storage is limited and the store moves around the world.
- Consequences are asymmetric. A missing gasket can stop an engine; a surplus gasket costs little.
These features make a single fleet-wide rule, such as "keep two of everything", both expensive and unsafe.
2. Classify before you calculate
Not every part deserves the same policy. Three independent classifications together decide how each part should be managed.
Criticality (VED)
Based on the consequence of not having the part when it is needed:
- Vital: the part's absence stops or seriously degrades a critical function, typically linked to ISM Code critical equipment or class-essential machinery.
- Essential: absence affects operations or efficiency but has a workaround or redundancy.
- Desirable: absence is an inconvenience.
Criticality comes from the equipment and the failure consequence, not from the price of the part. A low-cost O-ring on a critical fuel system is vital.
Value (ABC)
Based on annual consumption value (quantity used × unit cost). Typically a small share of parts (class A) accounts for most of the spend, and a large share (class C) for very little. Class A parts justify careful forecasting and tight control; class C parts are better managed with simple, generous rules.
Demand pattern
Syntetos, Boylan and Croston (2005) proposed classifying demand by two measures:
- ADI, the average inter-demand interval: the average number of periods between non-zero demands;
- CV², the squared coefficient of variation of the demand sizes when demand occurs.
Using the cut-off values they derived (ADI = 1.32 and CV² = 0.49), demand falls into four types:
| Type | ADI | CV² | Character | Suitable approach |
|---|---|---|---|---|
| Smooth | Low | Low | Regular, steady | Standard forecasting and safety stock |
| Erratic | Low | High | Regular timing, variable size | Wider safety stock |
| Intermittent | High | Low | Infrequent, similar size | Croston-type methods |
| Lumpy | High | High | Infrequent, variable size | Croston-type methods, or treat as insurance |
Most shipboard spares are intermittent or lumpy, which is why simple averages perform poorly.
A combined policy matrix
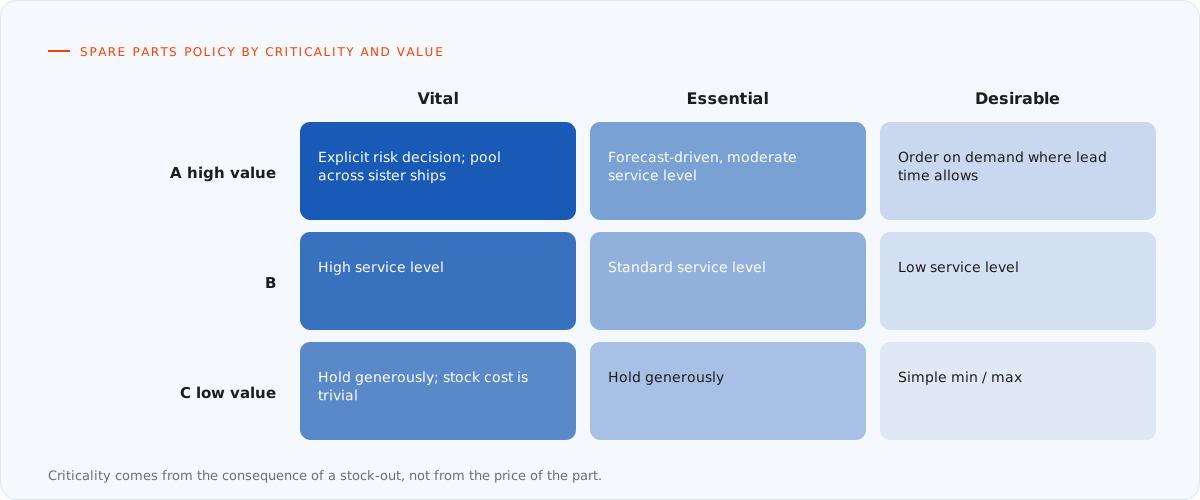
Figure 1. Combining criticality (VED) and value (ABC) gives each part a policy.
| Value ↓ / Criticality → | Vital | Essential | Desirable |
|---|---|---|---|
| A (high value) | Explicit risk decision; consider pooling across sister ships | Forecast-driven, moderate service level | Order on demand where lead time allows |
| B | High service level | Standard service level | Low service level |
| C (low value) | Hold generously; cost of stock is trivial | Hold generously | Simple min/max |
3. Three kinds of demand
Spare parts demand on a ship has three distinct sources, and each needs a different method:
- Planned demand from scheduled maintenance. If the PMS links each job to the parts it consumes, this demand is largely known in advance: the job, its due date and the parts list define it.
- Unplanned demand from corrective maintenance. This is random and must be modelled statistically from consumption history.
- Insurance demand for rare, high-consequence failures. Parts may go years without use but must be on board when needed.
Separating planned from unplanned consumption in the records is the single most useful data improvement a fleet can make. Mixing them hides the true random demand and inflates safety stock.
4. Planned demand: let the PMS drive it
For planned work, the PMS can produce a parts forecast directly:
- take every job due in the planning horizon, using running-hour projections for hour-based jobs;
- explode each job into its linked parts and quantities;
- subtract stock on board and on order;
- schedule the requisition so that delivery lands at a port call before the job's due date, allowing for the effective lead time.
This is the same logic manufacturers use for material requirements planning. It turns a large share of spares demand from a guess into a schedule, and it lets kits be assembled for major overhauls instead of ordering piecemeal.
5. Unplanned demand: reorder point and safety stock
For parts with reasonably regular unplanned demand, the classic continuous-review model applies. The part is reordered when stock (on board plus on order) falls to the reorder point:
Reorder point = d × L + SS
where d is average demand per period, L is the lead time in periods and SS is safety stock. With a constant lead time and normally distributed demand:
SS = z × σd × √L
where σd is the standard deviation of demand per period and z is the service factor for the target probability of not running out during a lead time (about 1.65 for 95 % and 2.33 for 99 %).
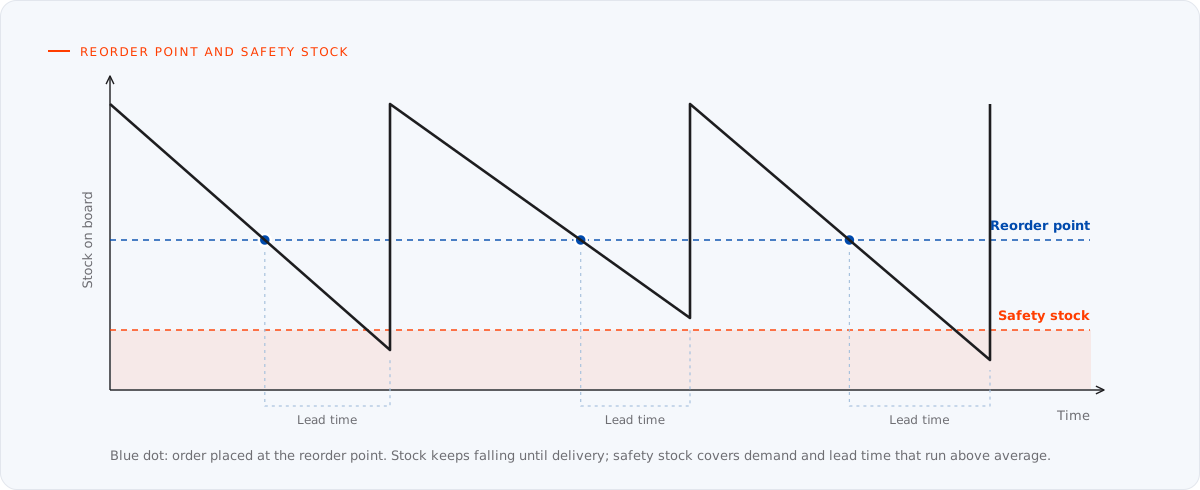
Figure 2. Continuous review: reorder at the reorder point; safety stock absorbs above-average demand and lead time (illustrative).
When the lead time itself varies, which it usually does for ships, the safety stock must cover both sources of uncertainty:
SS = z × √(L × σd² + d² × σL²)
where σL is the standard deviation of the lead time.
Worked example. A filter element is used on average 4 per month, with a standard deviation of 2 per month. Effective lead time to the ship is 2 months. For a 95 % service level, ignoring lead-time variation:
- SS = 1.65 × 2 × √2 ≈ 4.7, so 5 units
- Reorder point = 4 × 2 + 5 = 13 units
If the lead time varies with a standard deviation of half a month, the safety stock rises to 1.65 × √(2 × 4 + 16 × 0.25) = 1.65 × √12 ≈ 5.7, so 6 units. Lead-time variability alone adds a unit of safety stock, which is why reliable logistics are worth money.
6. Slow movers: Croston and Poisson
For intermittent demand, averaging over all periods understates the size of each demand and misjudges its timing. Croston's method (1972) forecasts the demand size and the interval between demands separately, and estimates the demand rate as their ratio. Later refinements, such as the Syntetos–Boylan approximation, correct a known bias in the original method.
For the slowest movers, it is often clearer to think in probabilities. If a part's demand follows a Poisson process, the probability of needing k units during the lead time can be calculated directly.
Worked example. A seal kit is used on average twice a year, and the effective lead time is three months, so the expected demand during the lead time is 0.5. The probability of needing at most:
| Units held at reorder | Probability demand during lead time is covered |
|---|---|
| 0 | 61 % |
| 1 | 91 % |
| 2 | 99 % |
Holding one kit at the reorder point covers about 91 % of lead times; holding two covers about 99 %. For a vital part, the second kit is cheap insurance. For a desirable one, it is probably waste. The criticality classification decides which.
7. Insurance spares
Some parts may never be used in a ship's life yet must be on board because their absence would immobilise the vessel for weeks: major components with long manufacturing lead times. The decision to hold them is an expected-cost comparison:
- Hold if the probability of needing the part over the decision horizon, multiplied by the cost of not having it (off-hire, towage, expediting, knock-on damage), exceeds the cost of holding it (capital, storage, deterioration, eventual obsolescence).
Two practical levers reduce the cost of insurance spares:
- Pooling. One spare held at a hub or on one ship can protect several sister vessels with the same equipment, if it can be moved quickly enough.
- Agreements with makers for priority supply or exchange units, which shorten the effective lead time and reduce what must be held.
Some class societies, flag states and engine makers publish recommended spare parts for essential machinery, and charterers or owners may set their own minimum requirements. These should be checked and reflected in the minimum levels for the affected parts.
8. Obsolescence and standardisation
Parts do not last forever on the shelf or in the catalogue:
- Track maker notifications of discontinued items and decide on last-time buys or alternatives before stock runs out.
- Record interchangeability. Where the maker confirms that a part supersedes another, link them so stock of either can satisfy demand.
- Standardise across the fleet where possible. The more ships share a model, the more stock can be pooled and the better the demand statistics become.
- Review dead stock regularly. Parts with no movement for several years, for equipment no longer fitted, should be identified, transferred or disposed of.
9. What the PMS and stores data must hold
The methods above depend on data that many systems do not capture well:
- a part master with the maker's part number, the drawing and item reference, and interchangeability links;
- links from parts to jobs and equipment, so planned demand can be exploded and criticality inherited;
- consumption records flagged as planned or unplanned, with dates and quantities;
- actual lead times per supplier and port, not just quoted ones;
- criticality and minimum levels per part and ship, with the reason recorded;
- stock locations on board, so a part that exists can actually be found.
Paper 05 in this series describes how to structure equipment master data so that these links stay consistent across a fleet.
10. Measuring the result
A spares policy should be judged on outcomes, reviewed at least quarterly:
| Measure | What it shows |
|---|---|
| Fill rate | Share of requests met from stock on board |
| Stock-out events on vital parts | The safety outcome that matters most |
| Emergency orders and their cost | The price of gaps in the policy |
| Inventory value and turnover | Capital tied up, and how fast it moves |
| Dead stock share | Value with no movement over a set period |
| Planned demand coverage | Share of planned jobs with all parts on board before the due date |
Conclusion
Spare parts decisions are risk decisions. Classifying parts by criticality, value and demand pattern; forecasting planned demand from the PMS; modelling random and intermittent demand with appropriate methods; and making insurance decisions explicitly turn a store full of habits into a policy that can be defended in cost and in safety. Every step depends on clean links between parts, jobs and equipment, which is why spares optimisation starts with PMS data.
References and further reading
- J. D. Croston, "Forecasting and stock control for intermittent demands", Operational Research Quarterly, 1972.
- A. A. Syntetos, J. E. Boylan and J. D. Croston, "On the categorization of demand patterns", Journal of the Operational Research Society, 2005.
- E. A. Silver, D. F. Pyke and D. J. Thomas, Inventory and Production Management in Supply Chains, CRC Press.
- International Maritime Organization, International Safety Management (ISM) Code, section 10.
- Companion papers: From instruction book to job library, Equipment hierarchies and master data and Reliability-centred and condition-based maintenance.
Reviewing spares across your fleet? We link spare parts to equipment and jobs from the makers' parts lists, and prepare the data for criticality and stock-level reviews. See our Inventory Management & Audits services.